![]()
Operating in the 2006 CQWW 160 CW Contest
The following note describes and shows spectrum analyzer pictures of the MFJ-1026 cancelling noise at the K0TO station location near Idaho Falls, Idaho. The dates were January 28 and 29, 2006 [Jan 29 and 30 if one uses UTC times].
A few days before the start of this contest some very strong (S9+5dB) noise appeared covering 160 through 15 meters.
Looking at the noise on a spectrum analyzer it was possible to see the amplitude and frequency of the noise pulses. That information confirmed that the noise was generated by 60 Hz AC lines. In spite of the fact the noise was so strong, it had not been pinned down to a particular location by the time the contest started. There were noise nodes at many points along the nearby power lines which made RFI locating more difficult. Added to that was the mix of daily snowfall, wind and moderately cold temperatures which discouraged people from walking about looking for line noise.
Faced with the noise I put my MFJ-1026 into service on 160 meters. I used my dual loop, switchable direction K9AY array as the listening antenna and my 160 meter vertical fed through the RX out port of the MFJ as the sense antenna. The combination worked reasonably well as can be seen in the spectrum analyzer pictures of what the receiver was hearing.
In the first five hours of operating I found I had worked 382 stations including the XE, KH6 and KG4 multipliers. No Europe, Africa, South America or Asia. At the of the 9-1/2 operating hours the total was 525 net QSO's, 53 multipliers (48 states -no AK,VT) and 6 countries for a total score of 72, 393 points. That was considerably more than I had anticipated when the noise had not gone away by the start of the contest. And it would certainly have been much. much lower if the MFJ-1026 had not worked so well.
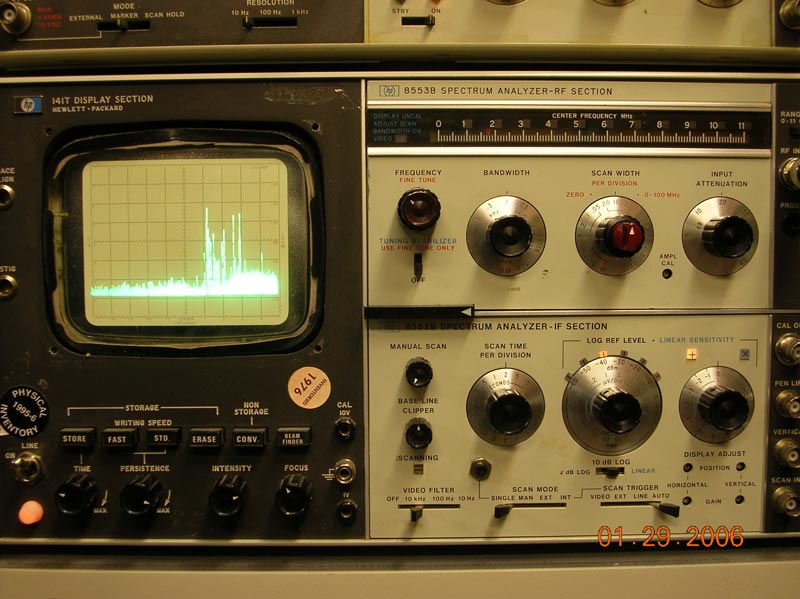
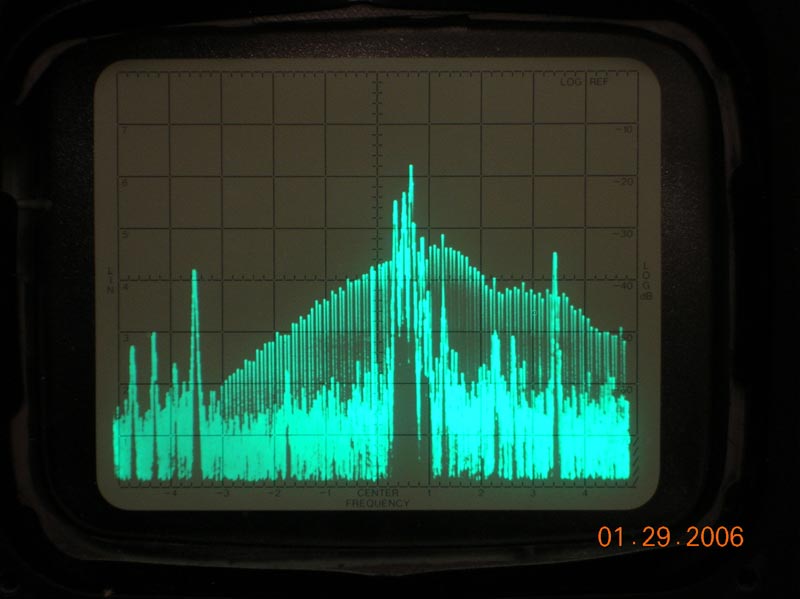
Picture 1 following shows the spectrum analyzer and a display of a portion of the 160 meter band. The MFJ-1026 has been used to cancel the noise on the low end of the band. Looking closely at the settings for the analyzer you will see that the IF bandwidth is 100 Hz and the Scan Width is 10 kHz per division. The Center frequency is 1.8 MHz so the vertical midline of the display is the bottom end of 160 meters. The Log Ref level is set to -40 dBm so the top of the display is at that value. The third horizontal line down from the top is approximately S9 on the FT1000MP receiver. The bottom of the trace has been clipped at -110 dBm. The display shows some loud signals way above the noise floor of the spectrum analyzer (about -105 dBm). These signals have Signal-to-Noise levels of 30 to 40dB.
On my particular FT1000MP I have measured S0 at -101 dBm. That would be the sixth line down from the top of the screen. You can see that there are signals showing on the analyzer below the sixth line so I should be able to copy such signals even though they do not move the S-meter. In fact, that was the case. I could copy signals quite well that did not provide and S-meter reading when I was using the 250 Hz filters of the MP. Late in the contest I made a contact with W0EB in KS who was running 5 watts. The time was 4:30 in the afternoon local time -- somewhat before sunset here in Idaho. This display shows that from 1800-1820 kHz or so the noise has been cancelled quite well. Picture 2 shows only the display.
Picture 1.
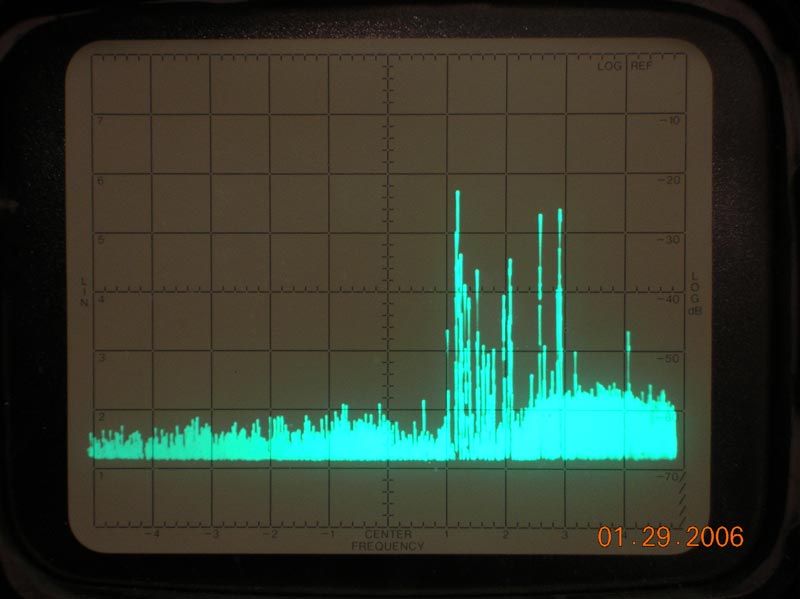
Picture 2.
This picture shows quite clearly the effect of the MFJ-1026 on the noise at my location. In the picture above the Center Frequency is 1800 kHz and each division is 10 kHz so we see the bottom 50 kHz of the 160 meter band. The -30 line corresponds to S9 on my FT1000MP. The -60 line corresponds to S0. As you can see there are a number of signals below that line and above the noise floor of the spectrum analyzer (about -115 dBm) at these settings. [see picture 3 following]. The 'ambient noise level after cancellation seems to be about -107 dBm but because of all the signals around 1810 we can't be certain if it is that higher or actually somewhat lower. This is not as quiet as the best locations are, but it seems to allow reasonable contest operating.
Picture 3.
The noise begins to grow at about 1820 kHz and that is what I observed listening to the receiver. The MFJ-1026 needed very slight adjustment when I moved more than +/- 10 kHz from a particular frequency if I wanted the best signal to noise level at a particular frequency. When one is searching and pouncing in the contest, the range will be somewhat more because you usually select signals that you know you can copy to call.
The next picture gives an idea of the noise that one would hear if the MFJ was not nulled.
Picture 4.
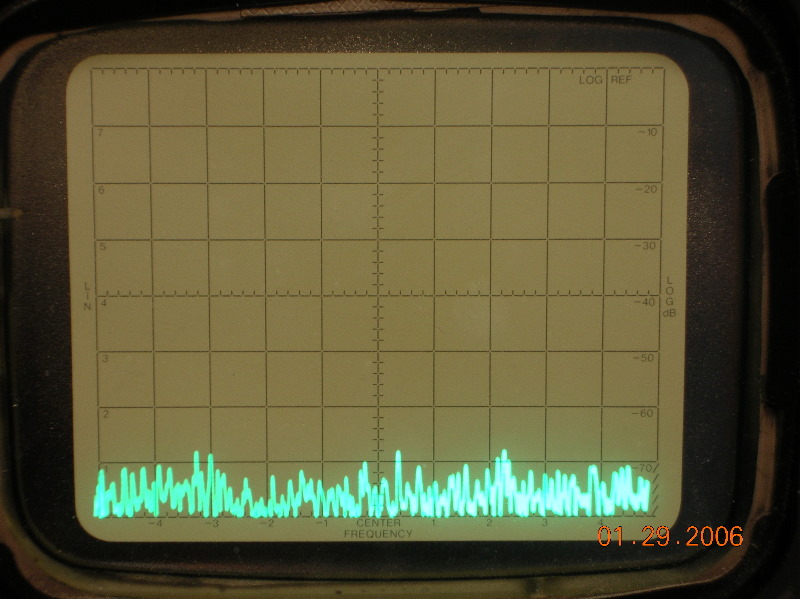
This picture shows the MFJ-1026 'de-tuned' from the null. Again, this is with an IF of 100 Hz. The noise level is about -85 dBm or perhaps S7 on the FT1000MP. That is what you would hear with the 250 Hz filters in use. The next picture shows what happens when we use much wider IF filters -- this case 3 kHz filters.
Picture 5.
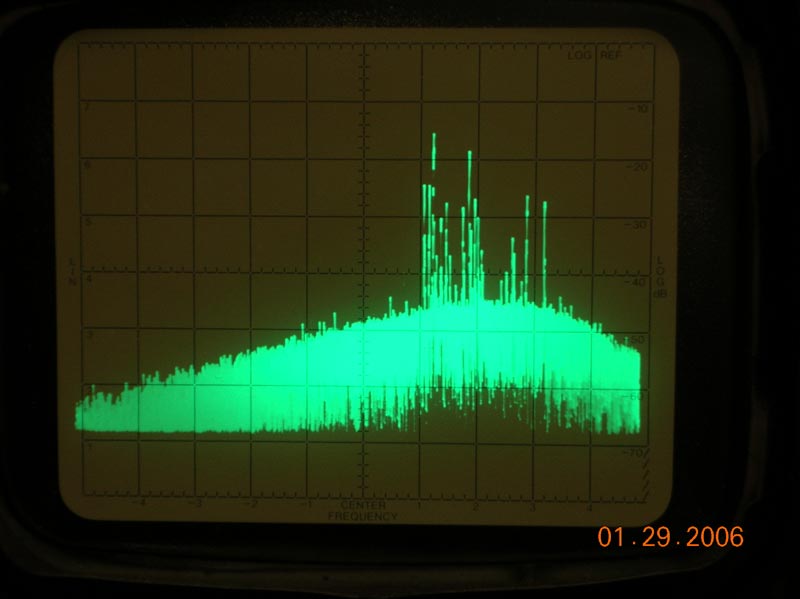
This picture has the same center frequency as the previous pictures but the scan is set for 20 kHz per division and the IF width is 1 kHz. From the center to the right edge we see 1800-1900 kHz. The MFJ noise canceller is not on. Also, I decreased the spectrum analyzer gain so that the -40 line is the same as S9 when listening on the FT1000MP. The sweep frequency is 100 milliseconds per division which provides six pairs of pulses per division. The noise envelope is quite visible and the signals envelope below the noise shows well also. At these settings the signals seem to go down to about -94 dBm where the become co-mingled with the noise. This is because the IF is so broad at 3 kHz and more noise is present. A good visual demonstration of why narrow filters are so important on 160 meters.
This is the end of the note at this time (Tuesday, January 31, 2006). I wanted to put this on my web site while folks might still remember their operating circumstances.
As usual, I welcome your comments and questions.
Tod Olson: tod@k0to.us